

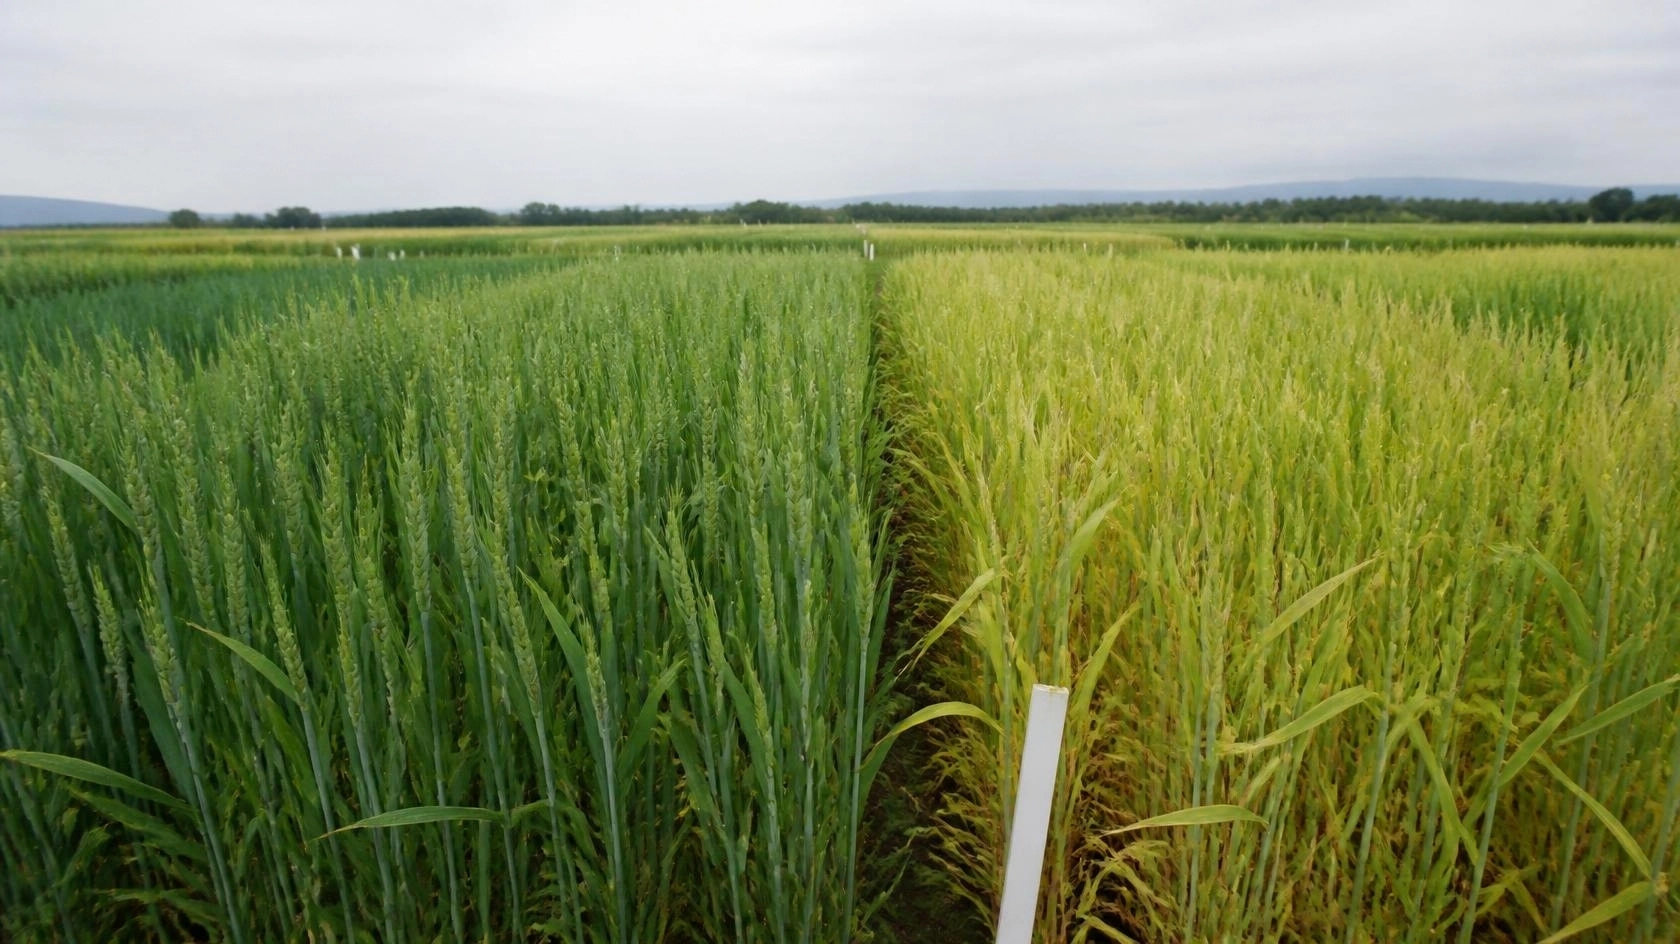
Getting nutrient mix ratios wrong doesn’t just reduce quality. It cuts yield, wastes inputs and compounds over time. Research confirms that balanced fertility management is the single highest-leverage decision a grower makes each season.
Introduction
Nutrient mix ratios and their impact on crop yield are among the most studied, and most mismanaged, variables in modern horticulture and commercial crop production. The proportions of nitrogen, phosphorus, potassium and secondary nutrients in a fertility program determine how efficiently a plant builds biomass, sets fruit and fills grain.
Imbalances don’t just reduce efficiency. They trigger cascading effects across root development, microbial activity and nutrient uptake, often creating yield losses that aren’t visible until harvest.
For professional growers managing production at scale, understanding ratio science means the difference between consistent performance and costly shortfalls. Getting ratios right from the start, and adjusting them through the season, is where precision agronomy delivers its clearest return.
What Nutrient Mix Ratios Are (And Why They Drive Yield)
Nutrient mix ratios are the proportional relationships between essential plant nutrients in a fertility program, and they drive yield by governing how efficiently a plant absorbs, transports and uses each element. When these ratios are correctly balanced, uptake is maximized at every growth stage. When they are off, efficiency drops and yield follows.
Crop nutrition accounts for up to 60% of crop yield while representing only about 20% of total production cost, according to CropNutrition.com. That leverage makes ratio management the most cost-effective tool available to growers. Key reasons ratios matter:
- Uptake efficiency: Nutrients compete for the same transport pathways, so excess of one blocks absorption of another
- Soil chemistry: Imbalanced ratios alter pH buffering and microbial activity in growing media
- Yield quality: Ratio errors affect fruit size, protein content and shelf life, not just total biomass
- Environmental risk: Surplus nutrients leach into waterways when ratios exceed crop demand
The N:P:K Ratio: Foundation of Every Fertility Program
The N:P:K ratio is the foundation of every fertility program because it sets the macro-level balance from which all other nutrient decisions follow. An N:P2O5:K2O ratio of 4:2:1 is globally recognized as the ideal macro-level standard, according to FAO. Deviations from this baseline carry measurable yield costs.
Vegetative vs. Reproductive Stage Ratios
Plants shift their nutrient demand as they move from vegetative to reproductive growth. During vegetative stages, nitrogen drives leaf area and canopy development. During flowering and fruiting, phosphorus and potassium become proportionally more critical for root energy transfer and fruit fill.
A review of more than 150 studies found that high corn yields were linked to systems where plants took up nitrogen and phosphorus at a 5:1 ratio and nitrogen and potassium at a 1:1 ratio, regardless of region, according to EcoFarming Daily. Growers who don’t adjust ratios between stages leave yield on the table.
Common N:P:K Imbalances and Their Yield Penalties
Nitrogen excess is the most common imbalance in intensive production systems. Long-term field experiments show that omitting potassium from an NPK program decreased wheat yield by 47% and rice yield by 15%, according to ResearchGate.
A 2025 sweetpotato study found that full NPK treatment increased storage root yield by 34.8% to 53.1% compared to single-nutrient deficiency treatments, with the greatest yield reduction occurring under phosphorus-deficient conditions, according to Plants, MDPI. Phosphorus is consistently the most penalizing omission in intensive systems.
The C:N Ratio and Its Effect on Nutrient Availability
The carbon-to-nitrogen ratio in growing media and soil organic matter directly controls how much nitrogen is available to the crop. This ratio is often overlooked by growers focused on NPK alone, yet it governs the microbial processes that release or lock up plant-available nitrogen.
The Immobilization Risk: When C:N Ratios Work Against You
When C:N ratios exceed 25:1, soil microbes consume available nitrogen to decompose organic material, starving the crop in the process. The USDA NRCS identifies 10:1 as the ideal agricultural soil C:N equilibrium, according to the USDA NRCS Soil Technical Note.
Common crop residues create serious immobilization risk. Wheat straw carries a C:N ratio of 80:1 and corn stover sits at 57 to 60:1, according to K-State Extension. Incorporating these residues near planting time directly competes with the following crop for nitrogen.
Optimal C:N Targets for Common US Cash Crops
Research from Nature Scientific Reports found a significant negative correlation between annual rice yield and soil microbial biomass C:N ratio (r = -0.99), confirming that the higher the ratio, the lower the yield. This relationship holds across paddy production systems.
For most US cash crops, maintaining soil C:N ratios below 20:1 supports consistent nitrogen mineralization. Growers using cover crops or organic amendments in their growing media programs should account for residue C:N ratios when timing incorporation to avoid suppressing early-season nitrogen availability.
Root:Shoot Ratio: How Resource Allocation Shapes Harvest
The root-to-shoot ratio reflects how a plant allocates resources between below-ground foraging and above-ground harvestable biomass. Nutrient imbalances force plants to over-invest in roots at the expense of yield. A meta-analysis of 50 field studies found that under nitrogen deficiency, root length per shoot biomass increases by 33%, according to Frontiers in Plant Science.
“The root-to-shoot ratio was enhanced by 44% overall, and by 64% in winter wheat specifically, under nitrogen-poor conditions.” – Frontiers in Plant Science
Harvest index for modern grain cultivars typically falls between 0.4 and 0.6. Research shows that 80% of wheat yield improvement between 1860 and 1982 was associated with increases in harvest index, according to RSEco.org. Keeping root:shoot ratios balanced through proper fertility is essential to maintaining that gain.
Secondary and Micronutrient Ratios That Growers Overlook
Macro ratios get most of the attention, but secondary and micronutrient ratios can silently erode yield before visible symptoms appear. Once a deficiency is detected, the plant has already suffered irreversible yield loss, according to Pioneer Agronomy. Critical ratios to monitor include:
- N:S ratio: The diagnostic threshold for sulfur shortage is greater than 20:1 for corn, greater than 14:1 for rice and greater than 16:1 for soybeans
- Magnesium: Mild Mg deficiency causes 8% to 11% yield reductions; a global meta-analysis found Mg fertilization increased yields by approximately 8.5% across diverse crops, according to MDPI Plants
- Sulfur availability: Plant-available sulfur in soil has decreased by 34% to 86% between 2000 and 2020 due to reduced atmospheric deposition, according to The Furrow
- Zinc and iron: Approximately 45% of the world’s cereal-growing soils are low in available zinc and iron, according to UCL
How Ratio Imbalances Translate to Measurable Yield Loss
Ratio imbalances translate directly to measurable yield loss, not minor inefficiencies. The losses are dramatic, quantifiable and compound across seasons. Understanding where these losses originate helps growers identify which imbalances to correct first and how urgently those corrections need to happen.
Signs of Ratio Imbalance by Crop Stage
Early-season imbalances often appear as uneven emergence, pale interveinal coloring or stunted root development. Mid-season symptoms include premature leaf drop, poor pollination and reduced fruit set. Late-season signs include thin grain fill, low test weight and elevated disease pressure.
Recognizing these symptoms by stage allows growers to intervene before losses become permanent. Tissue testing during active growth provides the most actionable ratio data.
Quantifying the Yield Impact
In a long-term NPK omission experiment in the North China Plain, balanced NPK plots yielded 9,081 kg/ha of maize versus only 1,809 kg/ha in the unfertilized control, according to PLOS ONE. That represents more than an 80% yield loss from ratio neglect alone.
A 2025 systematic review confirmed that integrated nutrient management can increase crop yields by 8% to 150% versus conventional imbalanced practices, according to PMC. Site-specific nutrient management improved maize yields by 69% compared to standard farmer practices.
Nutrient Ratio Interactions in Growing Media
Growing media composition directly influences how nutrient ratios perform in practice. Peat moss-based growing media, for example, affects cation exchange capacity and pH buffering, which in turn controls how available each nutrient is at a given ratio.
A 2026 Frontiers review identified “Liebig-synergism” in 20 documented cases, where correcting two deficient nutrients simultaneously produced yield increases of 1.5 to 35 times the predicted additive effect, according to Frontiers in Sustainable Food Systems. Growing media selection and ratio management are not separate decisions.
Testing and Adjusting Nutrient Ratios During the Growing Season
Growers who don’t test can’t manage ratios precisely. Only 61% of growers surveyed did any soil testing in the previous season, and the majority tested less than 10% of their crop area, according to GRDC. A practical in-season testing approach includes:
- Pre-plant soil testing: Establish baseline N, P, K, S, Mg and pH before seeding or transplanting
- Tissue testing at key stages: Sample at vegetative establishment, early flowering and fruit set to catch ratio drift before it costs yield
- Petiole or sap testing: Provides real-time nutrient status for high-value crops where rapid correction is possible
- Growing media analysis: For container and greenhouse production, test media pH and EC at regular intervals to confirm ratio stability
“Validation trials using soil-test crop response-based nutrient ratio recommendations achieved grain yields up to 68.85 q/ha for a 65 q/ha target, a 29.3% increase over the general recommended dose.” – PMC / NCBI
Conclusion
Nutrient mix ratios are not a one-time decision made at the start of a season. They are a dynamic management variable that shifts with crop stage, growing media composition, residue history and environmental conditions. Growers who treat ratio management as an ongoing discipline consistently outperform those who rely on static programs.
The research is clear: imbalances in N:P:K, C:N, root:shoot and micronutrient ratios all carry measurable yield penalties. Closing those gaps through targeted testing and science-driven fertility adjustments is one of the most reliable paths to stronger, more consistent production outcomes.
Frequently Asked Questions
How much does soil testing for nutrient ratios cost in the United States?
Basic soil testing in the United States typically runs $15 to $30 per sample through university extension labs, with comprehensive panels including secondary and micronutrients ranging from $50 to $150 per sample. The global soil testing market was valued at USD 4.3 billion in 2025, reflecting growing grower investment in precision ratio management. Growers who adopt soil-test crop response recommendations consistently report yield gains that far outpace testing costs.
How do nutrient mix ratios affect crop production across different US regions?
Regional soil chemistry varies significantly across the United States, meaning the same NPK ratio performs differently in the Pacific Northwest versus the Corn Belt. As of 2023, only 27% of U.S. farms and ranches used any precision agriculture practice, according to CropLife. Regional soil testing and locally calibrated ratio recommendations are essential because national averages don’t account for local pH, organic matter and micronutrient baselines.
What is relative yield and how does it relate to nutrient ratios?
Relative yield expresses crop performance without fertilizer as a percentage of maximum yield with optimal fertilization. At zero nitrogen, relative yields in cool-season grass hay crops range from 25% to 70%, according to CSA News. This range illustrates how dramatically ratio-based deficiency shapes baseline productivity. Growers targeting economic optimum ratios, rather than theoretical maximums, consistently achieve the most profitable outcomes per unit of input.
How do nutrient mix ratios in growing media compare to field soil ratios?
Growing media used in container and greenhouse production behaves differently from field soil because it lacks the buffering capacity of mineral soils. Peat moss-based growing media has a naturally low pH and minimal cation exchange capacity, which means nutrient ratios must be managed more actively. A 2025 meta-analysis found that mixed nitrogen fertilizer increased crop yield by 7.42% versus urea alone, with greatest gains in soils where pH was managed within the 5.5 to 6.5 range, according to Plants, MDPI.
How quickly can correcting a nutrient ratio imbalance improve yield?
Correction speed depends on the nutrient, the crop stage and the delivery method. Foliar applications of sulfur or magnesium can show visible response within 7 to 14 days. Soil-applied corrections to phosphorus or potassium ratios typically take one to two seasons to fully express in yield data. Research shows that more than 80% of farmers who adopted expert-based fertilizer ratio recommendations increased both crop yield and farm income, according to PMC, confirming that structured ratio management delivers consistent results across production systems.